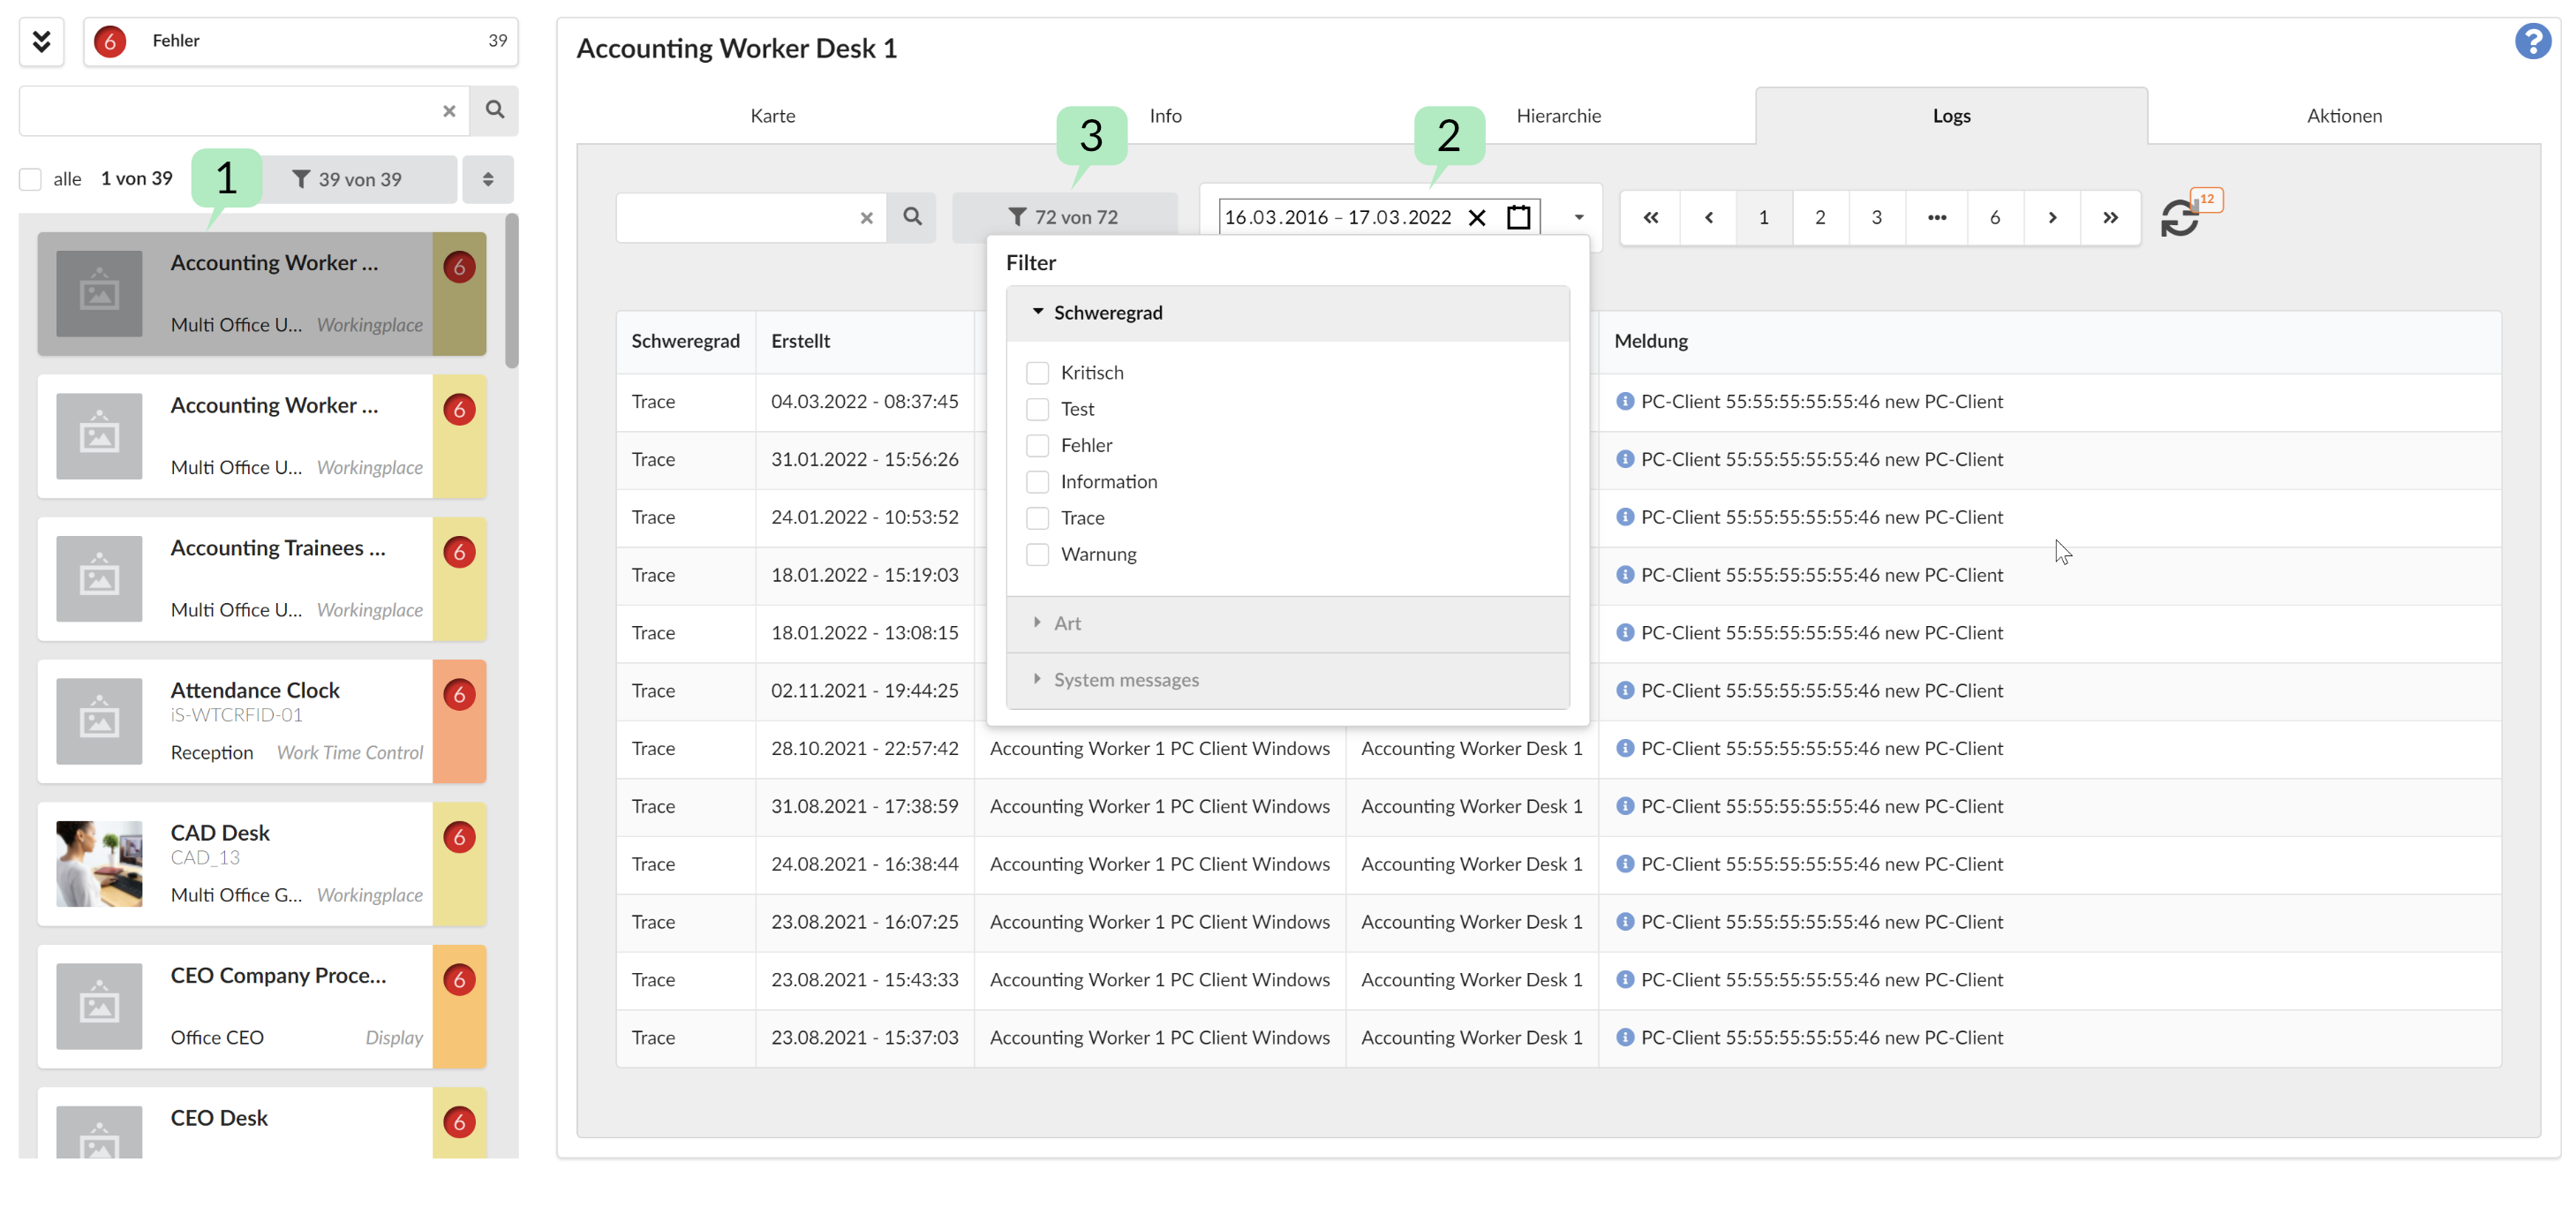
Logging tab
note
This page has been automatically translated and has not been reviewed in detail yet. Therefore, the translation might not be completely accurate.
In the Logging tab you can display logs written by components, which can be particularly helpful for error analysis. Since, depending on the components used, a large number of logs may be written (usually not only "error" type logs are written), the following filtering options are available:
Basically, only log entries from left 1 selected groups (or subordinate components) are displayed in the log table (multiple selection is possible with CTRL + Click and checkbox "all" ), which are in the date window 2.
The logs can also be restricted using 3
- Severity: Trace, Test, Informational, Warning, Error, Critical
- Type: All component types can be individually selected or deselected here
- System messages:
- If this switch is not switched on, only logs for components and groups are displayed
- Otherwise, logs for time control processes, switching sequences and scripts are also displayed (in the latter only in the event of errors)

Remarks:
- In the current state of implementation, to change the time interval you have to click this 2, then first select the start date in the calendar that appears (click on the left) and then select the end date (click on the left). You cannot change the start or end date individually.
- If there are many log entries, appropriate pagination is activated
- If the display is no longer current, the number of added messages will be displayed in the recycling arrow at the top right (12 in the example)