CSV export
This page has been automatically translated and has not been reviewed in detail yet. Therefore, the translation might not be completely accurate.
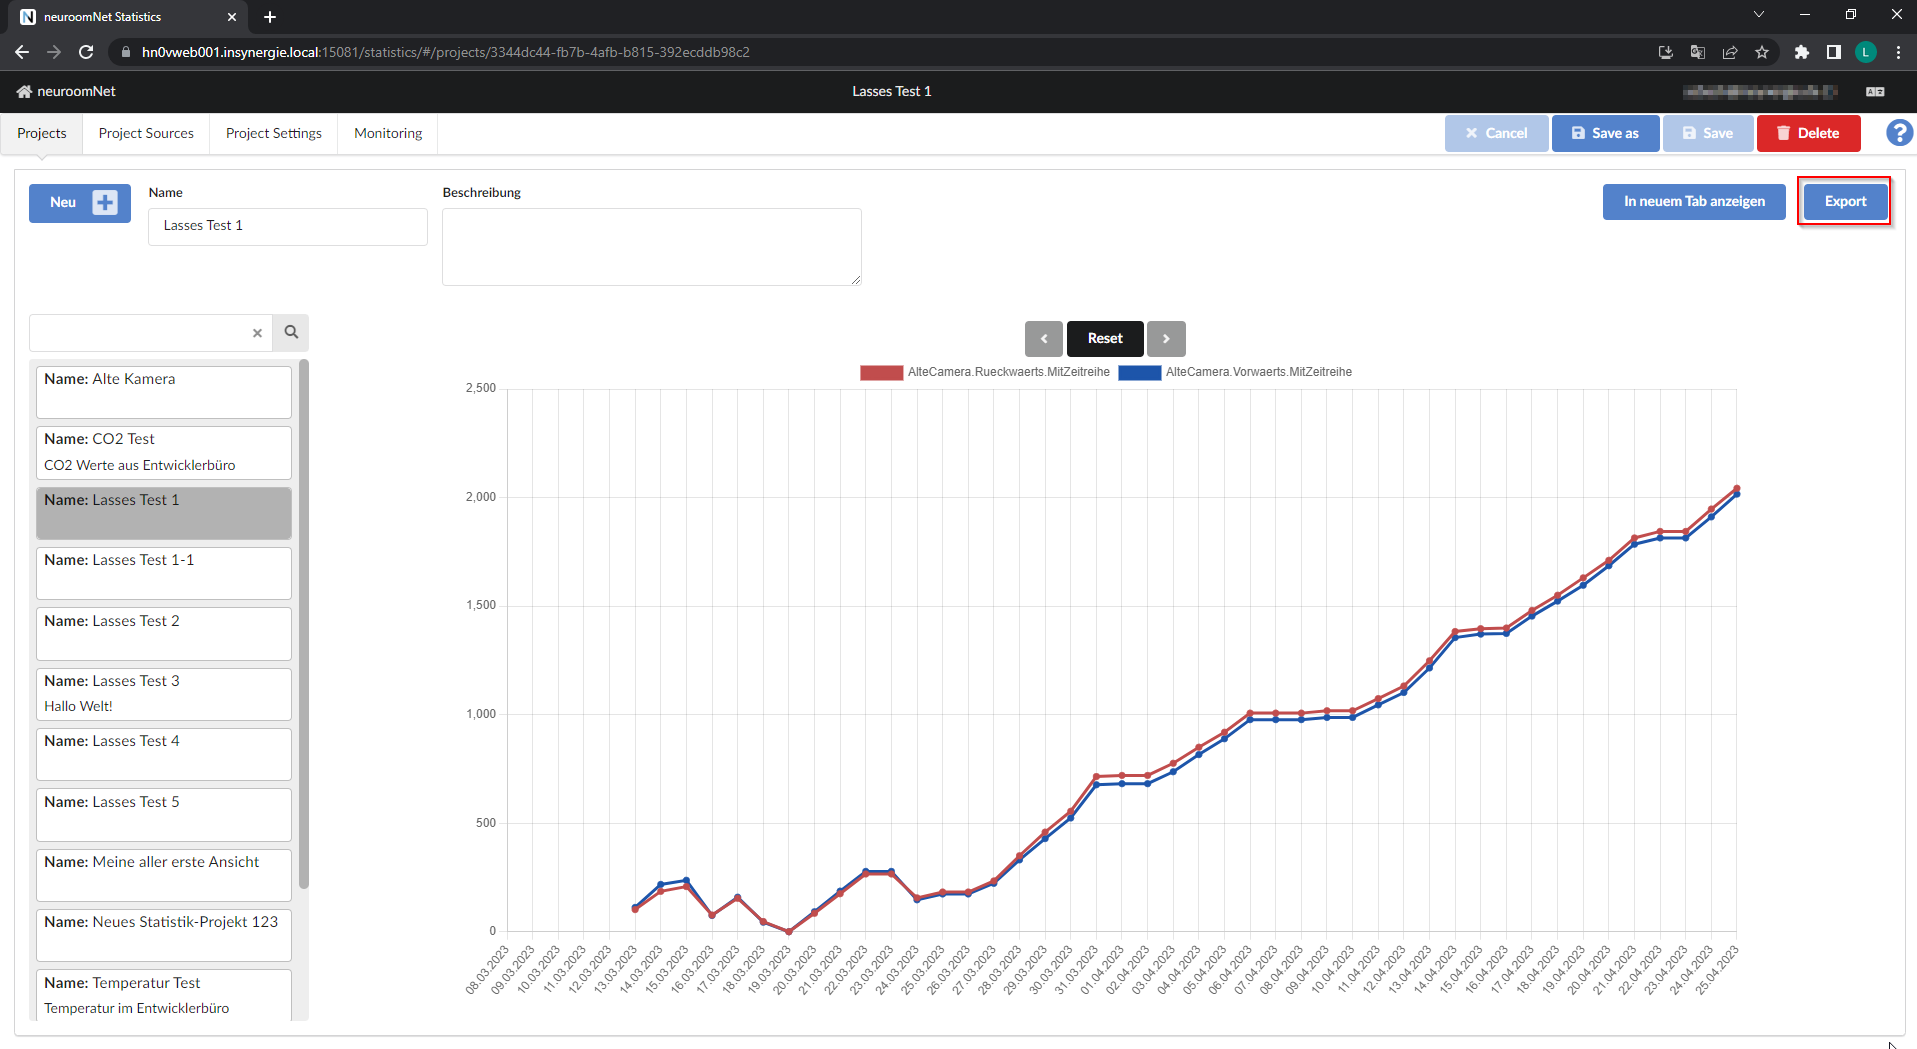
Data from existing statistics projects can be exported as a CSV file using the “Export” button at the top right:

Strictly speaking, the export is currently not implemented as a “Comma-Separated-Value”, but as a “Tabstop-Separated-Value” (e.g. this makes it easier/more direct to import into Excel in the German localization).
The Excel export for the above time series is as follows (for better clarity, shown below using "[...]"):
when OldCamera.Backwards.WithTimeSeries OldCamera.Forward.WithTimeSeries
earlier
13.03.2023 00:00:00.000 102 112
14.03.2023 00:00:00.000 186 218
15.03.2023 00:00:00.000 208 237
16.03.2023 00:00:00.000 77 75
17.03.2023 00:00:00.000 154 159
18.03.2023 00:00:00.000 47 44
19.03.2023 00:00:00.000 0 0
20.03.2023 00:00:00.000 85 92
21.03.2023 00:00:00.000 175 187
[...]
22.04.2023 00:00:00.000 1844 1814
23.04.2023 00:00:00.000 1844 1814
24.04.2023 00:00:00.000 1947 1911
25.04.2023 00:00:00.000 2056 2030
The first two lines of each Excel export have a different format and meaning than the other lines:
The first line of an Excel export contains the headings for the individual columns:
- when: time / timestamp of the respective data record (line)
- Variable 1: First variable / time series from the statistics project
- Variable 2: (possibly) second variable / time series from the statistics project
- ...
- Variable n: (possibly) nth variable / time series from the statistics project
Before we go into the 2nd line of an Excel export, first the explanation of lines 3 to the last line: Each such line describes a point in time and the values of all n variables / time series at this point in time (for all points in time from Display Start to Display End of the statistics project). Individual (or all) values can also be missing if there was no update/setting of the respective variable at the time (then the variable still has the value of the previous time, possibly recursively). This could have been implemented differently in the Excel export, so that missing values are automatically replaced by the previous value in the CSV, but this was not done because the information would be missing when no values were set, which is what happens with forms of "measurements". is important information.
The second line of every Excel export contains the text "earlier" instead of a point in time / timestamp, followed by n variables / time series values (which can also be empty) with the following meaning:
For each of the n variables / time series, the last logged value is included before the display start of the statistics project (which may be significantly earlier or may be missing completely, as in the example above). Background for this information (if this information is not necessary, it can be ignored or, for example, the 2nd line can be deleted): If values for one or more variables are missing at the beginning of the Excel export / statistics project, then this information can be used the beginnings of the corresponding curves/diagrams are visualized correctly instead of the start values being missing (possibly over a longer period of time).